

Using The Fingerprint Of Market Structure To Identify Entries
March 10th, 2003. Police find themselves on a gruesome murder scene with very little clues. A man lay on his couch, caked in his own blood from an attack that left little more than half of his face intact.
Amongst the ‘canopy of blood spatter’, very few clues would be available for use in determining the assailant or the motive. A fingerprint would ultimately lead to the primary suspect, found by an alert crime scene technician.
In the carnage of the market, there are almost always fingerprints left, leading you to profitable trade locations. It’s simply a matter of knowing what to look for, as you sort the garbage from the real evidence.
It can be the difference between profit and the never-ending cold case losses that many retail traders never solve.
A clue to cracking the market you can’t ignore
Fingerprints first found their way into English economy when James Herschel, a Chief Magistrate, used them as a personal form of identification in 1858. At that time, a handprint was used to sign a contract. It was J. Edgar Hoover who brought the discipline of using forensic fingerprint analysis to the FBI as a basic means of collecting evidence.
Ever since candles have been introduced to charts as a means of tracking price and movement, structure analysis has been a fundamental method for spotting trade locations. Just as the laws of science (or whatever you believe) apply to matching a print to its owner — so do the laws of math and probability when factoring market structure.
Learning to spot and analyze basic market structures when they form allows you to spot high probability trade locations. These structures occur with high regularity and can be exploited as long as you know what to look for.
Classic market fingerprints to watch for
There are three fingerprint ‘class’ types: arch, loop and whorl. Arches happen to be the least common, occurring only about 5% of the time. Contained within those three basic patterns are countless features unique to that individual.
Regardless of the market you happen to trade, there are classic patterns that you should watch for when looking to spot an opportunity for an entry. You don’t have to conduct a forensic analysis to find them — just keep your eyes peeled for:
- Head & Shoulders: A primary price peak supported by two supporting, lesser peaks on either side. For a bullish SHS, expect the peak to be at the bottom pointing down, and for price to head back up coming off the second shoulder. The reverse is true for a bearish SHS, with price heading down after the second shoulder.
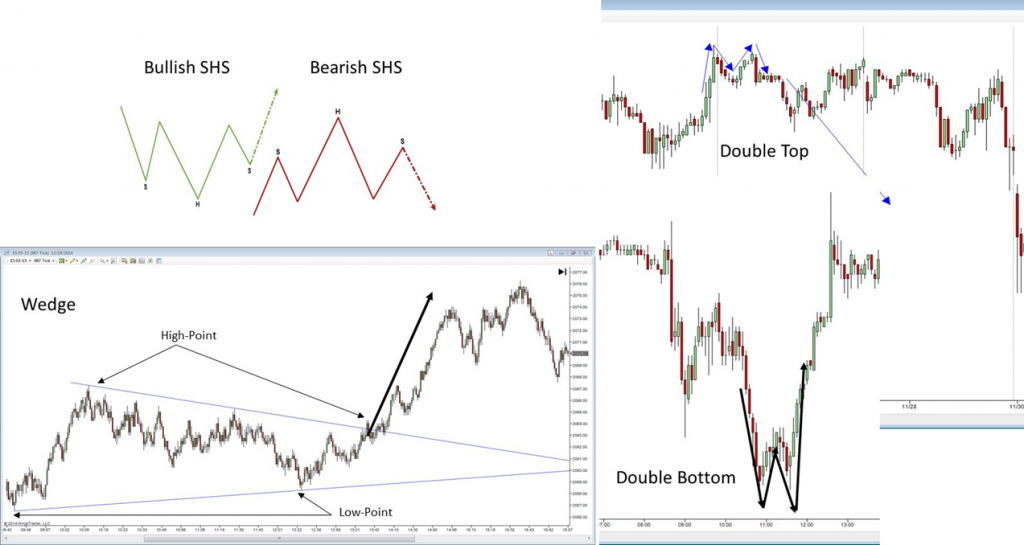
There are classic patterns that you should watch for when looking to spot an opportunity for an entry.
- Double Bottoms/Tops: When price is at an extreme and tests a low (or high) point once, you could have the beginning of a double bottom (or top on the high side). When it comes back for a second time, prepare for a bounce.
- Wedges: Keeping track of trend lines created by highs and lows in price will often result in a wedge formation — especially if price is consolidating. Breaks to either end of the wedge are bounce/reversal opportunities. As you get further to the narrow point of the wedge — prepare for a breakout and a trend in that direction.
Extremes that catch profitable entries red-handed
Murder cases across the world have been upheld on the strength of fingerprint analysis. It’s clean, hard to refute, and ties evidence directly to the accused when used properly.
These entries are predicated on two basic concepts: value extremes and verification. When price reaches an extreme, odds are really good that you’re in overbought or oversold conditions — a great opportunity.
When it comes back to test that extreme, you have verification in the form of support or resistance to make your move. There are zillions of patterns based on candle shapes, tails and formations — but many of them don’t hinge on testing value or extremes.
As a fundamental rule, when value is being tested and price is on the run — you have an opportunity to make an entry.
Turning around a cold case of profits
Everyone talks about patterns, so why should you consider these?
Similarly, a return to the fundamentals of market structure can help you curb a string of mounting losses. Looking for these basic structures requires patience and discipline. Taking your entries only when they take formation means that you’re likely passing on a lot of other trades that could otherwise burn you.
When you’re dealing with a losing streak, and your account is taking a beating – your batting average needs to go up. Taking entries founded in extremes is a great way for you to turn it around.
Profit confidently using the market’s own fingerprints
It was a pack of Newports, sitting on a side table near Gregory Harris’ head that did the culprit in. Since blood spatter was found on the pack’s underside, it was determined that it was moved after the homicide.
Additionally, a fingerprint was found on the cellophane wrapping ultimately leading police detectives to the killer.
When solving a market’s structure, you have the benefit of time and price to provide the ‘fingerprint’ clues you’re looking for. Determine how price has developed over time using a long- and short-term view of the market. Establish trends, highs, lows — along with support and resistance.
Identify patterns of classic entry fingerprints that you can use — such as double bottoms/tops or wedges. When price returns to the scene of the crime, profit — following the time-tested process of market structure.