

Taming The CL In Less Than 8 Seconds
Eight lousy seconds. That’s all you need. Forget the fact that the 1,700-pound bull is incredibly upset. Set aside the reality that you have no idea what direction it will buck. And stop thinking about what will happen if you fall off.
Those are details that someone else can worry about. Welcome to the logic offered in every bar in the world that has a mechanical bull for drunken patrons to ride.
Sound crazy? Well, that’s exactly what millions of traders do the second they saddle up a trade in the CL.
With absolutely zero sense of what the market is going to do, or where they should enter or exit – they throw caution to the wind and ride the bucking CL. Only to see their account cleared out – days, sometimes minutes, later.
Fortunately, you can take a step towards taming the CL with one addition to your chart. It’s a move that starts with one very simple acknowledgement:
You’re not in control. The bull is. And by the bull, we mean the institutions.
A way to size up any rodeo that involves crude
There are four judges in any bull riding contest. Two for the rider, awarding up to 50 points based on his performance and ability. Amazingly enough, there are another two that judge the bull! Can you believe it?!? The bull, who didn’t ask to be there anyway, has two judges doling out points on HIS performance?
Not fair, but very true. Same goes for any market you’ve ever looked at. Except it’s not the bull that you need to keep an eye on – it’s the institutions. They’re the ones that drive 90% of the market’s volume and they’re the ones that determine the score – not the guys sitting in their living room or home office.
If you’re looking for an accurate score of the market, then you need a way of determining when and where the institutions will buck. Price-based, lagging indicators will tell you they can answer this age-old question, but here’s the issue: They’re almost always late, wrong or both.
Why? They fail to take into account the volume that precedes price. Imagine being able to know in advance when a market is likely to buck.
Suddenly your eight seconds of terror turns into opportunity. And in an instant a market like the CL becomes a place of opportunity.
Institutional bells you’ll want to listen for
You might be shocked to learn that the primary piece of equipment used isn’t a helmet or gloves. It’s a bull rope. Setting aside the technical details that go with a bull rope – its biggest feature is that it’s designed to fall off the bull when he gets that irritating rider off its back.
Why does the rope fall off when the rider lets go? There’s a bell at the bottom. A bell! It gives the rope the weight it needs.
In every market there are all kinds of bells – but only one that you should really care about. It’s the bell of institutional trade activity. If you know when it’s going to ring – you have a chance of entering on the right side of price.
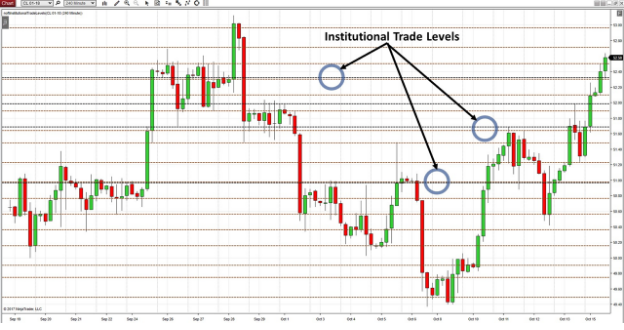
Take a look at the CL, with everything that’s happening abroad and the accuracy level of Institutional Trade Levels once they’re added to the chart.
Grab any reversal you like – see anything in the area? It’s a market bell in the form of an institutional trade level. Once you have these plotted on your chart – you now have a chance at making an entry – or plotting for a breakout.
Golden Buckle entry conditions for the CL
It was the Texas rangers – who had to be expert horsemen – that would go on to become ranchers who adopted the techniques and traditions that are now found in bull riding in the US. The origins of the sport, regardless of what you may think of it, stretch across the globe.
The same is true for Institutional Trade Levels. When a market like the CL is bucking, you need an entry point that you can count on. A price level you can watch with confidence even when the most volatile of moves may be underway.
By having institutional trade levels, founded in volume added to your chart, you can now add real time entry intelligence, like Order Flow Sequence Tracking, to determine if conditions are optimal for a swing or continuation trade.
As price approaches an institutional trade level, monitor the aggressive activity between buyers and sellers. Look for signs that the controlling side/force is starting to back away.
You’ll often see this in the form of Sequential Decline or Responsive Activity – or simply a shifting Delta. The exact opposite applies for continuation conditions. You’ll see the controlling force maintain its margins in with the delta and imbalances – along with continued stretches or runs in price.
The difference? You’ll have the price levels to wait on, instead of hanging on for dear life like everyone else.
Add institutional trade levels to your chart and tame a market like the CL with confidence!