Profiting From The Market’s Wave Report
They never stood a chance.
It was October 10th, 1903, and the luxury cruise ship, the Etruria, hit a rogue wave… It was at least 50 feet high and struck on the port side.
First-class passengers got the brunt of the wave, probably as they sipped their brandy, ate crumpets and smoked cigars. Some may call this a tragedy while others see it as poetic justice. Either way, it was a wipe-out.

Every day, in every market you trade — a market wave comes along. You can be sure of two things every time this happens…
One: Someone is getting totally wiped out — usually a helpless amateur day trader.
Two: Someone else is making an absolute killing from this price action.
Here’s the deal: Modern-day ships benefit from advanced sonar and wave reports that help them keep the wind at their backs, avoid bad conditions, and take advantage of friendly waters.
This information is detailed, precise and leaves nothing up to the imagination.
The same exact type of wave report is available for the markets you trade.
These ‘Wave Reports’ put the fierce winds of price action at your back if you know how to use them. They surface patterns that you can sail for profits.
The best part? You’ve heard of this strategy before. It’s called Elliott Wave analysis. And even better? It’s way easier to trade than you’ve been led to believe. Especially if you’re a day trader.
Two waves that can change your trading fortunes
The Etruria epitomized the luxuries of Victorian style. Heavy velvet curtains, ornately-carved furniture, huge expansive spaces. All the trimmings of a first-class experience that you’d be hoping for. Even the second-class accommodations were very nice.
The wave that was coming its way could have cared less.
Likewise the waves that hit the market every day.
When Ralph Nelson Elliott was looking at 75 years’ worth of market data, he spotted two types of waves that every trader should have an eye out for:
These waves can be pieced together to create larger patterns.
You can dial in patterns that appear in larger time frames into smaller 60-, 30-, and even 5-minute patterns.
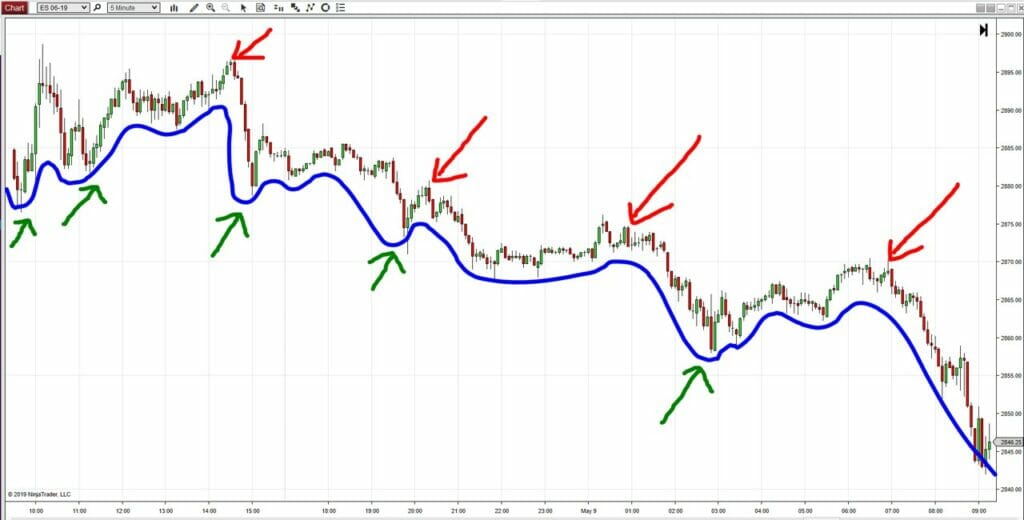
For example: Using the above ES 15-minute chart, you can casually see the trend and pullbacks at a glance. The science of Impulse and Corrective waves predicts this price action simply by monitoring the patterns and direction.
Just to recap as you look at this chart:
- The market makes a move in a particular direction… a trend… based on any number of events. That’s an Impulse Wave.
- After the Impulse wave subsides… the market corrects… and pulls back, just like the ocean. That’s a Corrective Wave.
Here’s what it looks like on an S&P chart:
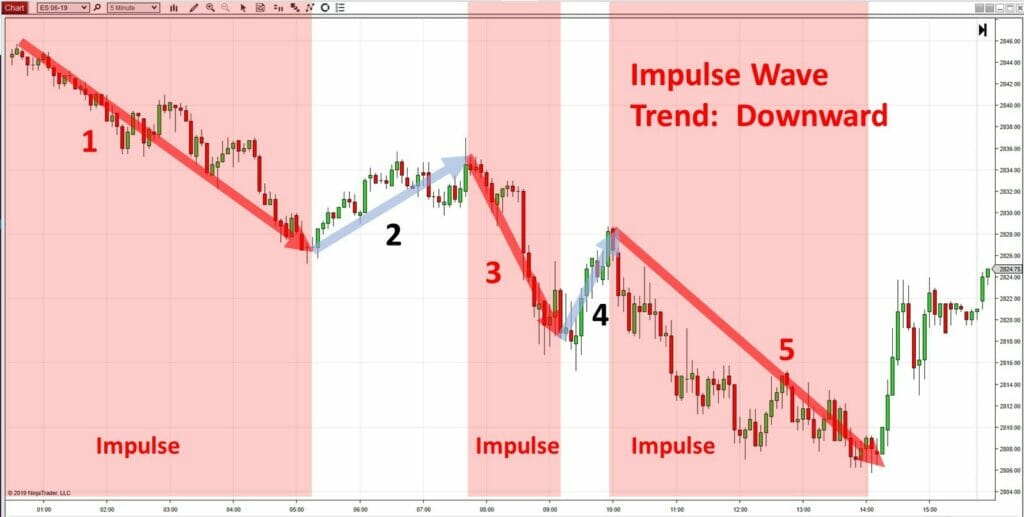
If you can spot the wave patterns… and you know what direction the market is headed… then you can make a boatload in profits — simply by sailing trades that go with the waves of the market.
This is where the high-probability, big-profit trades come for day traders.
If you’re new to this, then you might understand what all the hype has been about surrounding Elliott Waves.
For those of you that have been around Elliott Wave analysis, we’re simply looking at Impulse 1-5 to start, and then we’ll be watching for the A,B,C correction.
For the purposes of this article — let’s keep this very, very simple. (You can get your PhD in wave analysis later. For now, let’s see if we can actually turn a buck.)
How to analyze an Elliott Wave in seconds
For years, many thought that rogue waves were more folklore than reality. That is until Lituya Bay generated a wave that was 100 feet high after an earthquake. It managed to level trees as it ran 1,700 feet up the side of a mountain when it came ashore.
When an Elliott Wave rises, you can avoid being among the casualties and actually profit with one simple setup.
The second you spot an Impulse Wave, you’re looking for an opportunity to trade on the market’s reversal… or correction.
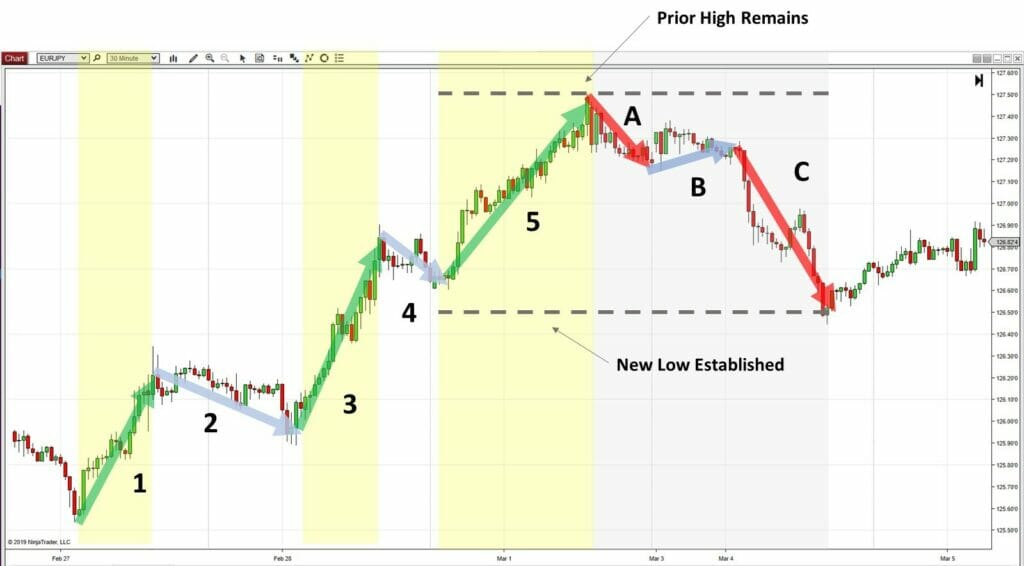
Check this out. Here’s a EUR/USD Impulse Wave (labeled 1-5) followed by a Corrective Wave labeled A, B, C.
We know that the correction is confirmed simply by watching the highs and the lows of the Corrective Wave — and how they line up with the prior highs and lows of the Impulse Wave.
Here’s a play-by-play on what we’re watching for:
- The Impulse Wave sets in with an uptrend. Leg 1 is followed by a pause in leg 2, and then a long continuation with Leg 3.
- Once Leg 4 in the Impulse Wave is complete, we want to mark the LOW. Why? Because that will be our line in the sand when the Corrective Wave sets in.
- The final Impulse Wave finished with Leg 5. We want to mark the HIGH. This is the high that we’ll be monitoring with the Correction.
- Next there’s a sharp move down, signaling the start of the Corrective Wave (Leg A) with a brief pause.
- When Leg B of the Corrective Wave starts, we’re watching to see if the high established with Leg 5 is taken out. It isn’t. The Correction is confirmed. Now we need to monitor Leg 4 of the Impulse to see if the low is taken out.
- When Leg C of the Corrective Wave runs past the low established in Leg 4, we can trade with that trend — downward.
For this setup, you’re looking for two basic conditions…
- Reversal: If the prior high in the Impulse Trend is not overtaken, and a new low established — look for a reversal and a downward trend to ensue.
- Continuation: If the prior high is not overtaken, but the prior low remains intact — start stalking a trade with the prior Impulse Wave trend.
More often than not, you can simply choose to enter when the high isn’t taken out at the end of the Leg. Here’s a quick sketch of what you’re looking for.
Bear in mind that depending on your trading time frame — your standard risk/reward rules should always apply.
Put a different way: Don’t stay in the trade longer than you normally would. Exit with your regular targets and honor your stops — even if they’re hit much earlier than you would like.
Profiting safely with Elliott Waves
There are literally thousands of Elliott Wave articles, videos and courses available. There are even 21 variations of the Corrective Wave. Consistently profitable traders live by one mantra that has kept their account alive and profits flowing — in all kinds of market conditions.
That mantra? Keep it simple.
Either the conditions exist, or they don’t. Save your heart and your account from the pain of trying to guess. If you don’t see it — don’t trade it. All too often, traders get so caught up in the maze of patterns, indicators and strategies that their charts become a jumbled mess.
This takes away from the joy of trading and adds avoidable risk.
Another key to profiting with Elliott Waves is to be selective. Just because you see a wave, doesn’t mean you should trade it.
Perfect example: If you see a textbook Impulse Wave followed by a Correction unfolding right before an interest rate announcement — should you jump in with the trend? Of course not! That announcement has the power to send the market in a totally different direction.
Talk about a rogue wave coming your way. Steer clear. Let the market unfold and apply your standard event-based trading strategies.
Consider Elliott Wave analysis as a supplemental strategy. Your own personal Market Wave Monitor that you can use for entry and exit confirmation.
Add this analysis to your chart and ride the wave of profits this analysis delivers. Download the FREE “Day Trading Elliott Money Waves” eBook HERE.