

How To Use Double Bottoms When Price Is About To Shipwreck
Nuestra Senora de las Mercedes, otherwise known as the ‘Black Swan’. This Spanish Navy frigate was sunk by the British off the south coast of Portugal on October 5th, 1804.
Bad enough for the Spanish, even worse that it was carrying 500,000 silver and gold coins. It was an American-based company, Odyssey Marine Exploration, that found the Mercedes — and promptly hauled the score (all 17 tons of it) back to the states in 2007.
Setting aside the fallout, the folks at Odyssey know how to hunt for and find treasure at the bottom of the sea. You too can have ‘Odyssey-like’ success, using the double bottom candle formation, when hunting for profits at the bottom of price.
Are you missing treasure at the bottom of your price levels?
It seems secrets are much harder to keep when they involve $500 million dollars. After the discovery and excavation of the ‘Black Swan’, word got out about the haul. Perhaps it was the fact that 17 tons of coins had to find their way from the Gibraltar to the U.S. (address undisclosed of course).
When the market is pushing price in any direction it’s hard not to notice. Especially when you’re dealing with the extremes that drive price to new highs or new lows. Like looking for a shipwreck, accurately gauging where the bottom of the market really is requires patience.
Eventually, the market will tell you pretty much exactly where the bottom is (for that period of time) in the form of a double bottom. These take the form of a ‘W’ that’s just in the process of being written. You can spot them quickly and easily, thanks to the pronounced points at the bottom.
When price hits the sea floor and bounces back up
Pinpointing the nationality of the ship was a chore for the experts. The Mercedes’ size and age was very vague and not much was released about the wreck site itself. Go wonder. When the experts came back, they only turned in a response filled with wonder about the ‘unprecedented’ nature of the find, but no details about the origin.
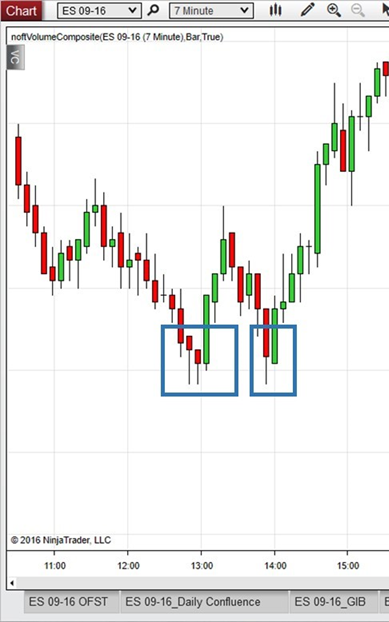
Mercifully, sorting out a double bottom is much easier. When price comes back to test a particular level — and respects it — odds are good that you’ve found solid support. Much like the letter ‘W’, you’re looking for a retracement of around 50% when price comes back up to form the middle peak, before coming back to test with the second dip.
This shape tells you that the buyers still have fight left in them, and that the sellers may be about to run out of gas. All you’re looking for is confirmation and the help of a historical resistance level.
Taking home the gold while others keep floundering
Eventually it was the Spanish government that raised their hand and filed a claim for the ‘Black Swan’ — claiming it was the Nuestra Senora de las Mercedes. A name fitting for a majestic ship that had been sunk by the British in what must have been a glorious fight.
When buyers and sellers are heaving cannon balls at each other, you can make a play with the buyers just as the sellers appear to have landed a fatal blow. It comes the moment the tide begins to turn.
When price completes the second test and completes it again — you can plot an entry as soon as you have confirmation that price is headed back up. You’ll want to watch for exhaustion signs at the bottom of the second peak in the form of long tails. Also be sure to keep an eye on volume — if it’s fully pegged, then your rebound may be short-lived.
Securing a real find while steering clear of fakes
On trending days, it can be difficult to really know if price will bounce back up — or if it’s really headed for a new level. Trading for a reversal during these periods can be especially difficult if you’ve been burned in the past.
If you’re concerned that price isn’t going to bounce and that it is in fact headed for a new low — or even a previously visited low — watch RSI (Relative Strength Index). If at the bottom of the second dip, RSI is right in the middle of the 70 / 30 index, then you know that the market has more energy to drop. If it’s bottomed out at 30 and headed for 20, then you know you’re in oversold conditions.
Another simple test: Simply look left. If price has respected the level that the double bottom has visited before, odds are very good that it will respect it again. If you have no prior history at that level, even on a daily chart — simply sit tight.
Keeping your score regardless of what price does
The Odyssey’s triumph was short-lived. Given the location of the shipwreck — a place where many vessels found their fate — it was easy to cloud the identity. It was the U.S. federal court, along with the Court of Appeals, that upheld the Spanish claim.
It was a small number of coins and effects from the ship that showed clear signs of an internal explosion — which in turn confirmed the Spanish claims that this was in fact the Mercedes.
You can spot the clear signs that the market has bottomed out — perhaps after an explosion of its own. Look for the double bottom formation at the bottom of a pricing extreme. After the bottom is found, tested, and the bounce ensues — make your entry with an eye on volume and strength.
Claim the success that’s rightfully yours regardless of how much time has passed!