

HOW TO STAND IN THE MARKET’S DRIVEWAY AND SIZE UP VALUE
There’s always one on every street. They move in, and don’t lift a finger. The lawn never gets mowed, the driveway never gets shoveled and there’s trash all over the place. These are the guys that drive you nuts.
You’ve been thinking of selling to take advantage of an overheated market – now you’re not so sure. You can literally smell your property value declining.
Disgusted neighbors around the world handle this age-old problem in different ways. Some move, some complain and some light a match. If you’re Jason Burke of Winona, MN – you grab a match and ask ‘Why not?’ when being hauled away.
Needless to say, dealing with value can be frustrating enough when standing in your own driveway. Millions of losing futures traders find it downright impossible – and that’s assuming they’re even looking for value.
Fortunately, you can size up a market’s value with as much certainty as spotting a neighbor who hasn’t taken the trash out in weeks. You just need to know where to look and what to smell for.
And you can follow that scent to consistent results.
Price: The last thing you should care about
It all seems to start the same way. There are more cars in the driveway. Painting crews come in, the landscaping gets touched up and then ‘bam’ – there’s a For Sale sign in the front yard. The parlor game can officially begin… ‘how much do they want for that casa, and how much are they gonna get?’
And make no mistake. Nobody cares how they do on the deal. They just want to know what it means for comparable home values in the neighborhood. The same exact dynamic unfolds on the two-way street of a market’s crazy auction system. Like any neighborhood, buyers and sellers are watching – and trying to figure out what the action means for their position.
Here’s the deal: Like the house across the street – if you’re watching price, you’re late. If you’re watching your indicator, you’re also late. Not just a little late – but way, way late. This is because price is just the market’s way of keeping score. If you want to get in front of big moves – like reversals or continuations – you need to be watching volume. And not just any volume – but the volume that tells you what’s going on with value.
Once you have a view of this, you’ll never look at your market the same way.
A way to immediately spot value on your chart
It’s like having your own Zillow on your chart. (That’s the online home value estimator for those of you who aren’t familiar. It’s great if you want to find out how much your brother-in-law really paid for the new shack they’re bragging about.)
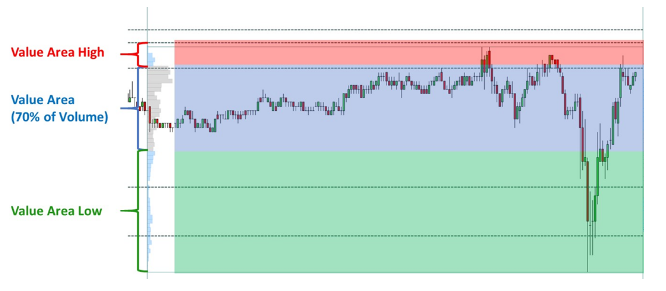
Back to volume. You’re specifically looking for the market’s volume profile. Once you have that, you’ll have three clearly defined areas you need to watch for. These three areas are the initial building blocks for any trade you’ll want to make:
- Value Area: This is where the bulk of the profile lives and where 70% of the volume takes place. Consider this to be the market ‘comps’ for your instrument. More importantly – you can’t expect to buy or sell much for a profit in the value area. If you’ve ever had to relocate – you know all about this zone.
- Value Area High: These are the price levels where the market has gotten too overbought. Prices are too high and the sellers are starting to come in.
- Value Area Low: The exact opposite of value area high. This is when price levels have gotten to oversold – they’re too cheap. Guess what – the buyers are on their way in.
Once you can quickly spot this – you’ll know exactly what you’re looking for when it comes to successful entries and exits.
Check out the ES example here to see a simple daily volume profile and its relationship with price.
You smell it, but you don’t know where it’s coming from
The number one complaint neighbors have around the world after noise? Smell. The kind of smell most commonly called in to local law enforcement? You can probably take a good guess with that one and be spot on. (No it’s not garbage.)
If you know what it’s like to deal with neighbors who have too much of a good time, then you’ve taken your first step in spotting market conditions that are perfect for an entry. It’s the extremes.
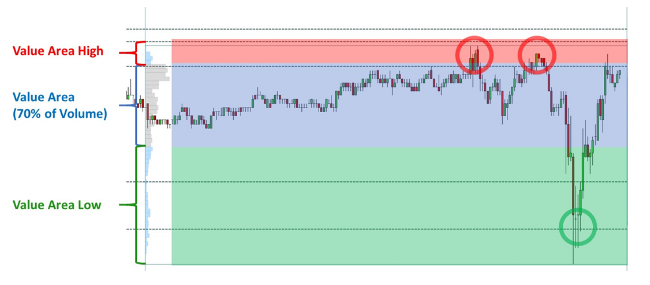
Once you have the value zone identified, you simply need to spot where the extremes set in and plot your entry accordingly. Unlike a distant odor that you can’t quite explain to your kids – you can pinpoint these market extremes with precise accuracy.
It’s a matter of watching the edges of the value zone. Specifically, the moments when it breaches Value Area High, or Value Area Low. These are the levels where price has a habit of reversing. Using the same ES example, with a basic 7-minute daily profile, you have three fantastic entries – all delivered to your driveway – just by watching the value area.
Now that you have a view into value, you can stop trading the market chop. Leave the frustration (and matches) to everyone else. Add a volume profile to your chart – plot the value zones and start entering for consistent results.