Using Indicators To Fuel Your Futures Trading Success
The indicator went green.
A BIG BUY ARROW that couldn’t be missed.
And so you entered. Just like they said in the video.
And then price went south.

Trading futures with indicators can either fuel success or cause wildfire losses. Follow these rules to avoid catastrophe!
In a matter of minutes a manageable loss turned into an account-burning nightmare. And you have NO idea what happened.
Perhaps the settings were wrong on the indicator? Bad data?
At this point it doesn’t matter. It’s over. If this trade were a wildfire, satellites would be able to spot the smoke from space.
Your account is smoldering embers. Your dream of trading is torched.
Every minute a futures market is open… you can bet that a trader somewhere is facing this horrifying, yet very real reality.
Their indicators are all finely tuned and ready to spot high-probability trades. And market conditions couldn’t be better.
Still… something goes wrong. And all hell breaks loose.
If you’ve ever felt this pain, or wondered how it can be avoided… Here's what you should know about using indicators in ANY futures market.
First: Know The TRUTH About Indicators
Safe trades. You know the ones. The ‘high-probability’ setups you promised your wife that you’d be trading?
You’ve got the same trusted indicator that millions of traders are using. There’s a zillion YouTube videos showing how it can be used with precision and confidence.
How could it be wrong?
Here’s the deal: They are wrong. All the time.
Take a fan favorite - the Relative Strength Index (RSI).
The premise for this momentum indicator is easy to understand:
>> Above 80 and you’re in overbought conditions - look for the sellers to step in.
>> Below 20 and you’re in oversold conditions - look for the buyers to take advantage.
Despite this, the RSI is often wrong.
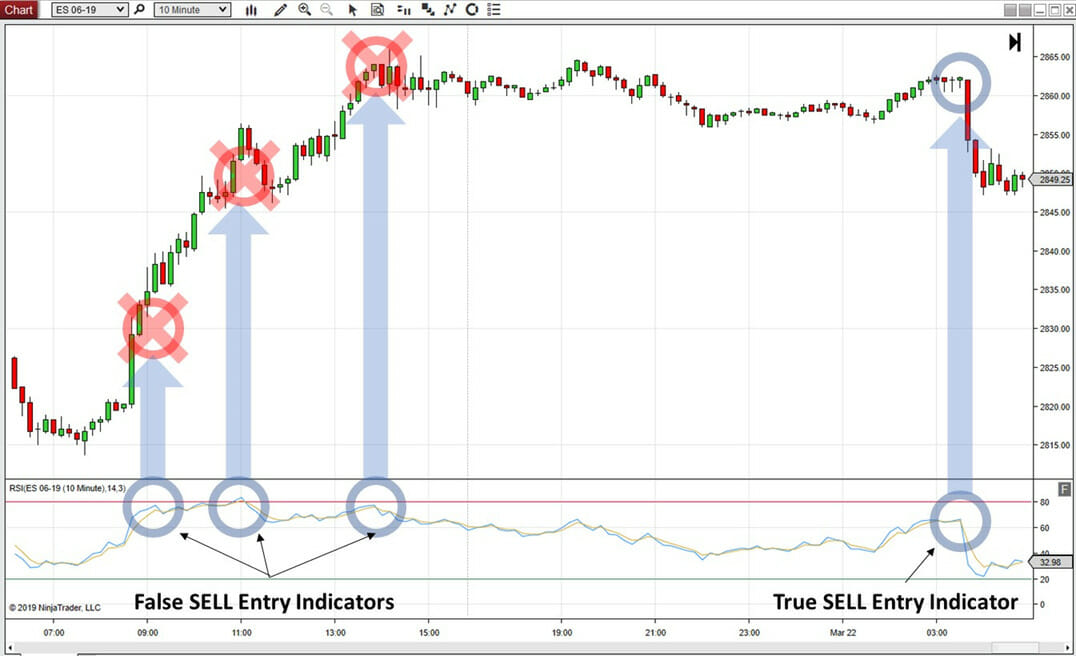
Take a look at this recent ES chart, covering an entire day.
At market open, the RSI touches 80, indicating an overbought condition.

Looking for a clear signal? Our beloved RSI can be wrong as often as it’s right!
Get ready for a sell entry? Not so fast, ace. Despite this clear-as-day signal… the ES went UP.
Watching just one indicator can lead to trades that lose way, way more than they win.
Second: Understand WHICH Indicators Do WHAT
Multiple indicators can paint a picture of the perfect trade.
They can also flag losing trades you should steer clear of.
But you have to know which indicators to use… and where to use them.
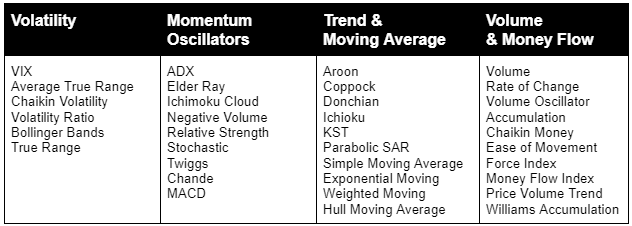
We can quickly put indicators available to pretty much everyone into four basic buckets:
Volatility: When the natural rhythm of the market is disrupted, a volatility indicator will flag periods where you might experience sharp swings in the market.
Momentum: If you want to understand the strength of a particular price move, momentum indicators can tell you if there’s enough gas in the tank to make a real move.
Trend: Want to hop on the speeding train and trade with the prevailing direction of the market? Trend indicators will tell you who exactly is at the wheel, and when they might be losing steam.
Volume: Nothing happens unless the institutional traders are on board. These are the guys that drive 95% of the market’s volume. Monitoring volume is a vital ingredient in validating what any of the other indicators may be showing.
With this approach, you can quickly organize the sea of indicators out there into easy-to-digest categories.

Third: Start With TWO Indicators For Easy Confirmation
You need more than one indicator, but you don’t need 10. In fact, it’s unlikely that you really need more than three.
We won’t choose the indicators for you, but we will give you a rule to follow when choosing which indicators to add to your chart.
Select indicators that complement each other, but do not use the same data. Since no one indicator is suited to all market conditions, you want indicators that, when consistent, will actually confirm an entry or exit.
Start here: Pick one trend indicator and one momentum indicator.

This will help you spot both continuation and reversal trades.
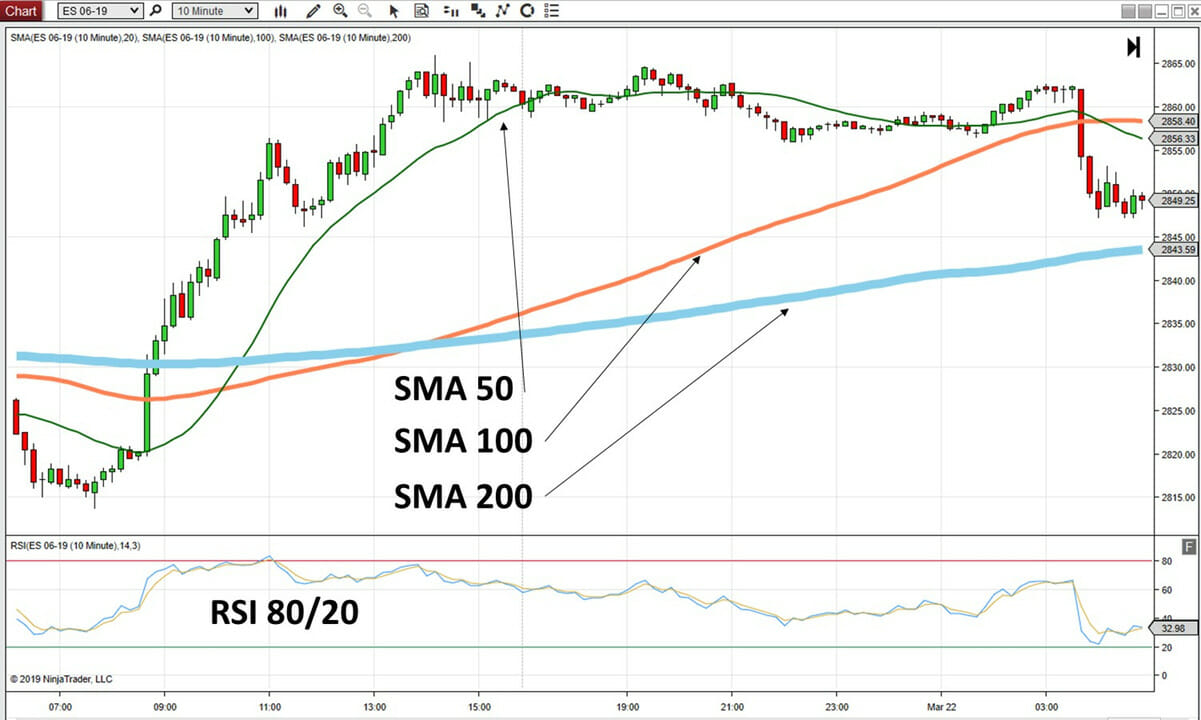
Here’s an example of the RSI paired with a basic Moving Average. In this case our Moving Average periods are set to 50, 100 and 200…
Since we’re looking for crossovers with the SMA specifically any time the 50 crosses over BOTH the 100 and 200 moving periods.
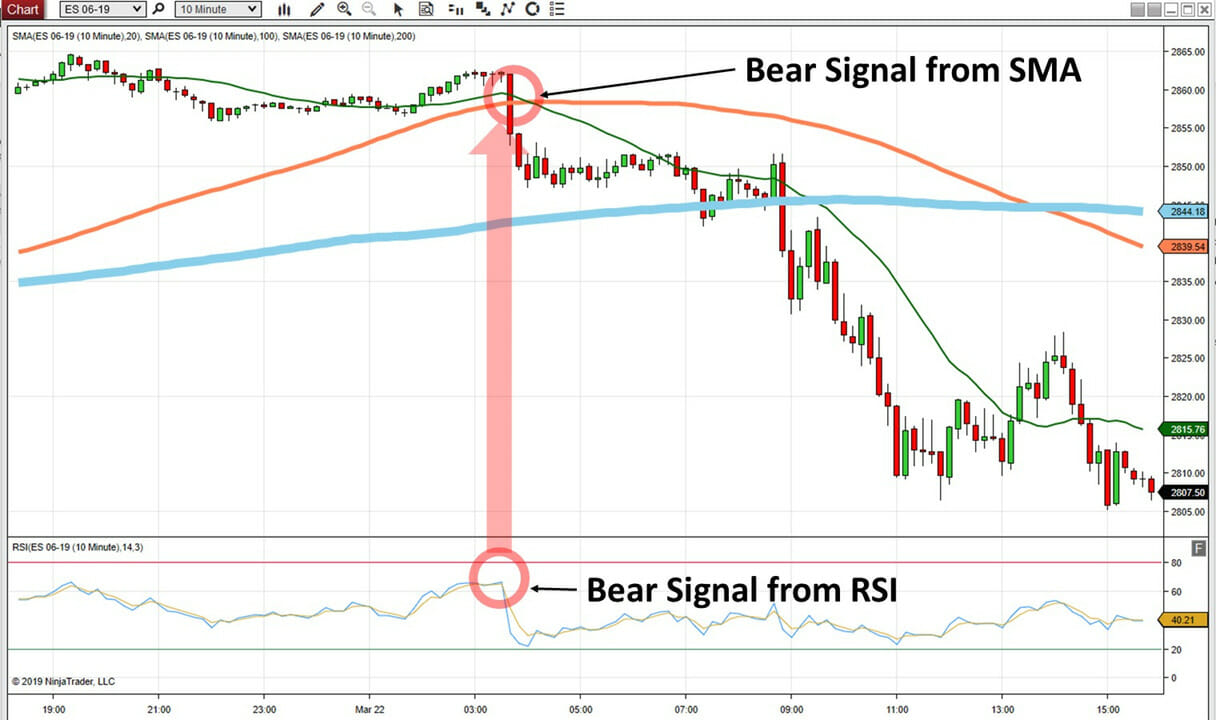
As the RSI is heading towards extreme overbought conditions, it makes a sharp move down.
And this happens just as the 50 period (green line) crosses under the 100.
Crossover at the 50 in combination with the sharp move in the RSI would have been good for several ticks of profit.

Additional indicator combinations to consider include:

As you’re picking and testing, simply follow these basic rules:
- Accept that indicators are wrong.
- Never rely on just one indicator.
- Fully understand how each indicator is used and what category it falls under (momentum, trend, volatility, etc.)
- Combine indicators for a more accurate view of your market.
Follow these NinjaTrader tips and you can trade using indicators with confidence.
To learn more about NinjaTrader, automated trading, Ninjacators indicators and more, check out our FAQ page.