It had a technical sounding name. Other countries had purchased thousands of them. And it was supposed to detect bombs and save lives. Yet it was nothing more than a repurposed version of a plastic toy sold as ‘Gopher: The Amazing Golf Ball Finder’ – which was often given as a gag gift.
Such was the pitch and the ultimate reality of the A.D.E. 651, which Iraqi security forces bought to detect bombs in an already fragile region. The tragedy behind this story is something made for movies – unbelievable in its scale and audacity.
Every day, in every market, retail traders attempt to detect and defuse trends – usually using faulty tools. Fortunately, there’s a reliable oscillator sitting in just about everyone’s toolbox in the form of MACD.
Trends that turn out to be toys
The case of the A.D.E. 651 raised an interesting question: Can something be considered fraud if nothing is done to cover up the truth? When it came to the jury trial that the seller would find himself in, he presented a heartfelt case that his machine did in fact work – at least in his own mind. It didn’t and never did.
Why is it that millions of retail traders wake up every morning convinced that they can sniff out a fake trend – when in reality their account would show otherwise? Perhaps it’s due to the fact that they’re hoping to read candle formations, with the goal of getting in on that perfect double top, or head and shoulders formation.
While those are great formations indeed, they don’t come with confirmation that a trend is ensuing – or that it has any momentum behind it. Fortunately there is an oscillator that helps with this very challenge – MACD.
A legitimate way to defuse trend swings before they explode
The truth behind how the A.D.E. 651 actually worked is both tragic and amusing at the same time, if that’s possible. Setting the supposed gadgetry aside (which was all fake), the only thing the fraudulent machine had going for it was gravity. That’s right, the antenna would simply fall up or down depending on which way the unit was pointed.

Fortunately, MACD relies on far more than gravity. Short for ‘Moving Average Convergence Divergence’, MACD’s trend-following momentum indicator shows the relationship between two moving averages of prices. It’s calculated by subtracting the 26-day exponential moving average (EMA) from the 12-day EMA.
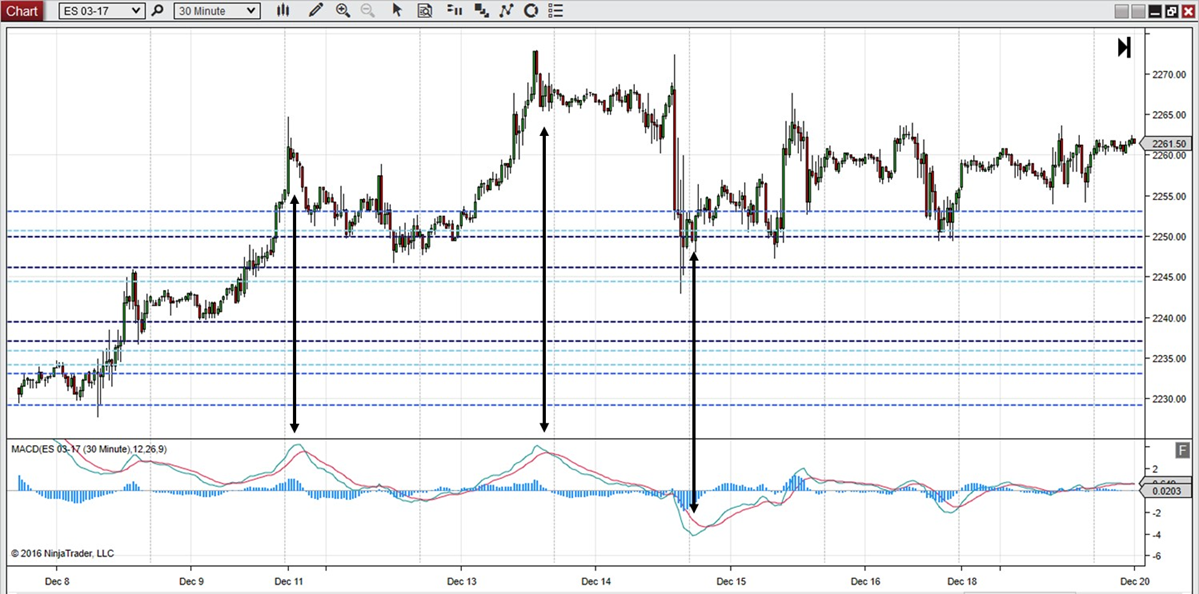
The goal is to monitor the crossovers between the two averages – including when they come together (convergence) and when they separate (divergence). Add any centerline or ‘zero’ crossovers and you have a great indicator to defuse the direction and momentum of a trend.
Making a successful entry on the side of momentum
Both the FBI and the Home Office in the UK quickly tuned in on the fact that the A.D.E. 651 was a phoney. With a world full of possible customers, it was Iraq of all places that couldn’t get enough of the ‘detector’. In one of the places that could have used a legitimate bomb detector, security forces were walking around with toys – literally.

When it comes to sniffing out trends, the MACD is not a toy. Indeed it’s used by professional traders around the world to keep an eye on momentum and get in early on trends. They’re simply keeping an eye on the relationship between the short-term average (also known as the fast) and the long-term average (also known as the slow).
Note the ES example here. When there’s a crossover a reversal ensues. As the gap or divergence between the two bands increases – so does the veracity of the trend. When they come together or hug the center line, you’re in no man’s land – sit tight. When they cross over the centerline – you’ve got a potential move that’s underway.
Don’t miss an obvious alternative right in front of you
It didn’t take long for a trained professional to realize there was no technology or science behind the A.D.E. 651, despite the earnest sales presentations that were delivered around it. Professional-grade casing and packaging was even developed to make it seem more legit.
MACD doesn’t need any window dressing and it’s right there on your trading platform for immediate use. Why don’t more retail traders take advantage of it? Possibly due to the fact that it requires a level of analysis that many aren’t comfortable with – specifically monitoring the divergence and convergence of the bands for solid indications of a swing.
If you’re not entirely sure that MACD is the right oscillator for you, simply add it to your chart and compare it with other strength and momentum indicators available. Compare the peaks and valleys with RSI (Relative Strength Index) and/or ATR (Average True Range). Although it’s not used to necessarily monitor overbought or oversold conditions – you’ll find that it holds its own.
Converting toys into success with one addition to your chart
When it was all said and done, some guy just outside of London came away with around $80 million from selling the A.D.E. 651. Vanity Fair would go on to write an amazing piece about the caper. A British prosecutor would go on to say that he didn’t seem evil – just ‘exceptionally greedy’.
Don’t fall for a fake trend again. Simply grab MACD and add it to your chart. Keep an eye on the two moving averages – monitoring divergence and convergence. When the two come together and even touch – then get ready for a move.
When the moving averages cross over the ‘trigger’ line, turn that move into an entry and then track the velocity of the trend that you’re moving with.
Confidently defuse trends with an easy-to-use tool that’s legit.
